Unlock the full potential of Excel for advanced data analysis with this four-week course. Designed for aspiring data analysts and business professionals, you'll master Microsoft's powerful tools: Power Query, Power Pivot, and Power BI. This program will transform your ability to handle, analyze, and visualize large datasets, moving beyond traditional spreadsheet limitations.

Excel Power Tools for Data Analysis
Ends soon: Grow your skills with Coursera Plus for $239/year (usually $399). Save now.

Excel Power Tools for Data Analysis
This course is part of Excel Skills for Data Analytics and Visualization Specialization


Instructors: Nicky Bull
77,061 already enrolled
Included with
Gain insight into a topic and learn the fundamentals.
1,319 reviews
Intermediate level
Recommended experience
Flexible schedule
2 weeks at 10 hours a week
Learn at your own pace
97%
Most learners liked this course
What you'll learn
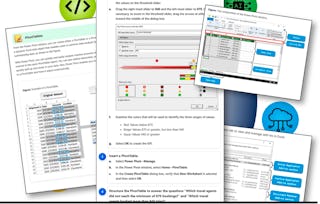
Master Power Query to automate data import and transformation
Utilize Power Pivot and DAX for advanced data modeling and analytics
Create interactive reports and dashboards using Power BI
Handle large datasets efficiently, overcoming Excel's traditional limits
Skills you'll gain
Tools you'll learn
Details to know

Shareable certificate
Add to your LinkedIn profile
Assessments
28 assignments
Taught in English
See how employees at top companies are mastering in-demand skills

Build your subject-matter expertise
This course is part of the Excel Skills for Data Analytics and Visualization Specialization
When you enroll in this course, you'll also be enrolled in this Specialization.
- Learn new concepts from industry experts
- Gain a foundational understanding of a subject or tool
- Develop job-relevant skills with hands-on projects
- Earn a shareable career certificate

There are 5 modules in this course
Earn a career certificate
Add this credential to your LinkedIn profile, resume, or CV. Share it on social media and in your performance review.
Instructors
Instructor ratings
(508 ratings)28 Courses1,653,278 learners
Offered by


Explore more from Business Essentials
 Status: Free Trial
Logical Operations
 Status: Free Trial
 Status: Free Trial
Macquarie University
 Status: Free Trial
Logical Operations
Why people choose Coursera for their career

Felipe M.
Learner since 2018
"To be able to take courses at my own pace and rhythm has been an amazing experience. I can learn whenever it fits my schedule and mood."

Jennifer J.
Learner since 2020
"I directly applied the concepts and skills I learned from my courses to an exciting new project at work."

Larry W.
Learner since 2021
"When I need courses on topics that my university doesn't offer, Coursera is one of the best places to go."

Chaitanya A.
"Learning isn't just about being better at your job: it's so much more than that. Coursera allows me to learn without limits."
Learner reviews
- 5 stars
87.40%
- 4 stars
10.92%
- 3 stars
1.36%
- 2 stars
0.07%
- 1 star
0.22%
Showing 3 of 1319
YN
Reviewed on Feb 1, 2022
It was a good experience of learning on course era which helped me a lot to improve my technical skills and also I would like to learn more courses on course era in future.
MG
Reviewed on Oct 7, 2021
Very nice course. Learnt a lot. The instructors Nicky Bull and Dr Prashan S. M. Karunaratne were good. Helped me to develop my knowledge on excel.Thank YouMahesh Gokhale
AG
Reviewed on Jan 26, 2022
This course was well-organized and well-paced, with reasonable assignments and assessments, and I was immediately able to apply what I learned to my job.

Open new doors with Coursera Plus
Unlimited access to 10,000+ world-class courses, hands-on projects, and job-ready certificate programs - all included in your subscription
Advance your career with an online degree
Earn a degree from world-class universities - 100% online
Join over 3,400 global companies that choose Coursera for Business
Upskill your employees to excel in the digital economy